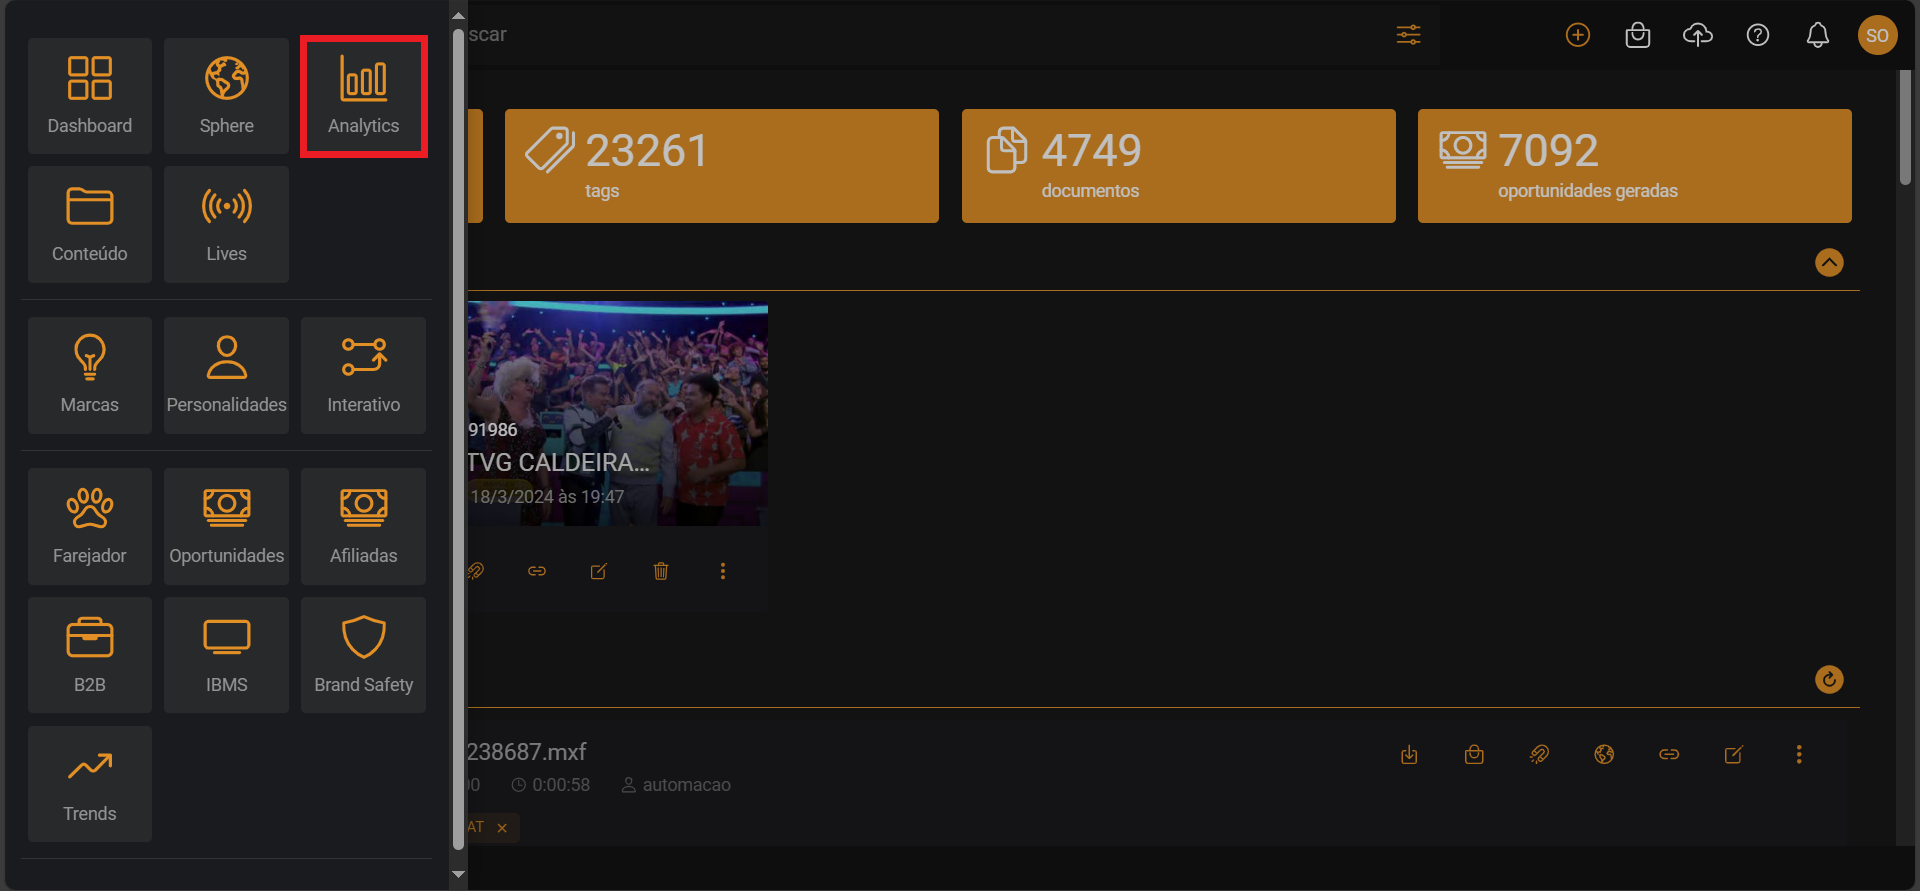
Menu - Analytics
In Analytics, you access Sphere's analytical dashboard.
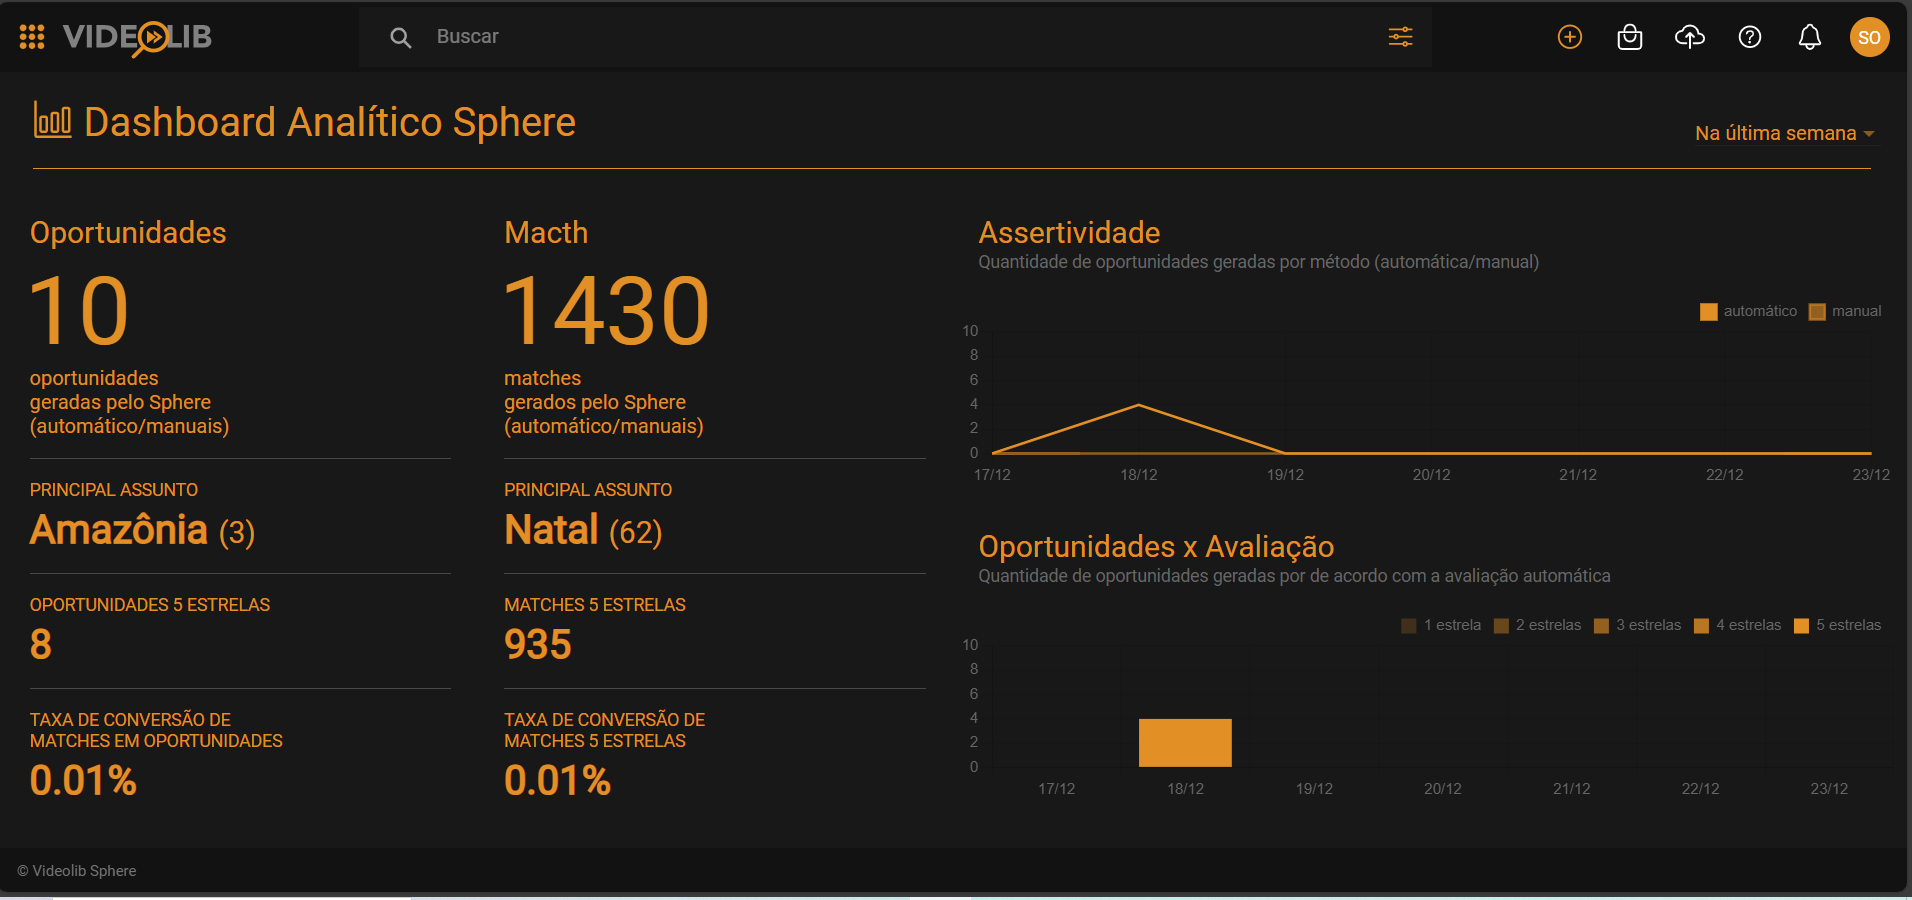
It shows Sphere Opportunities vs Matches.
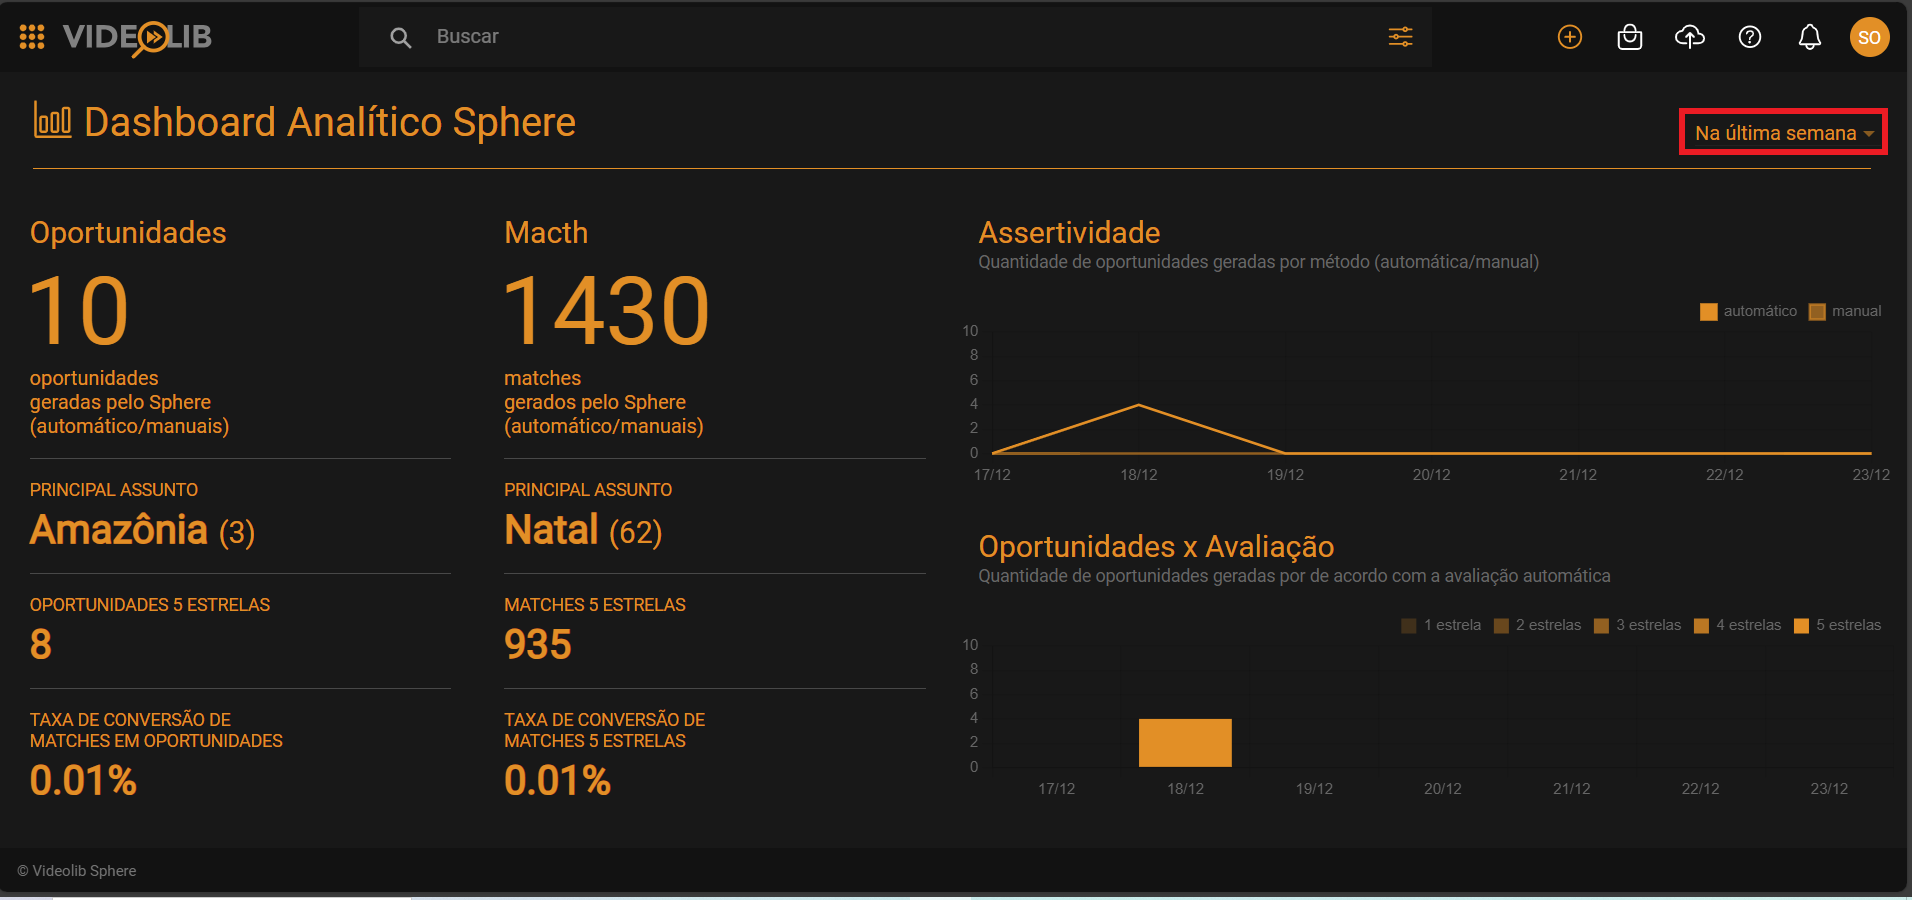
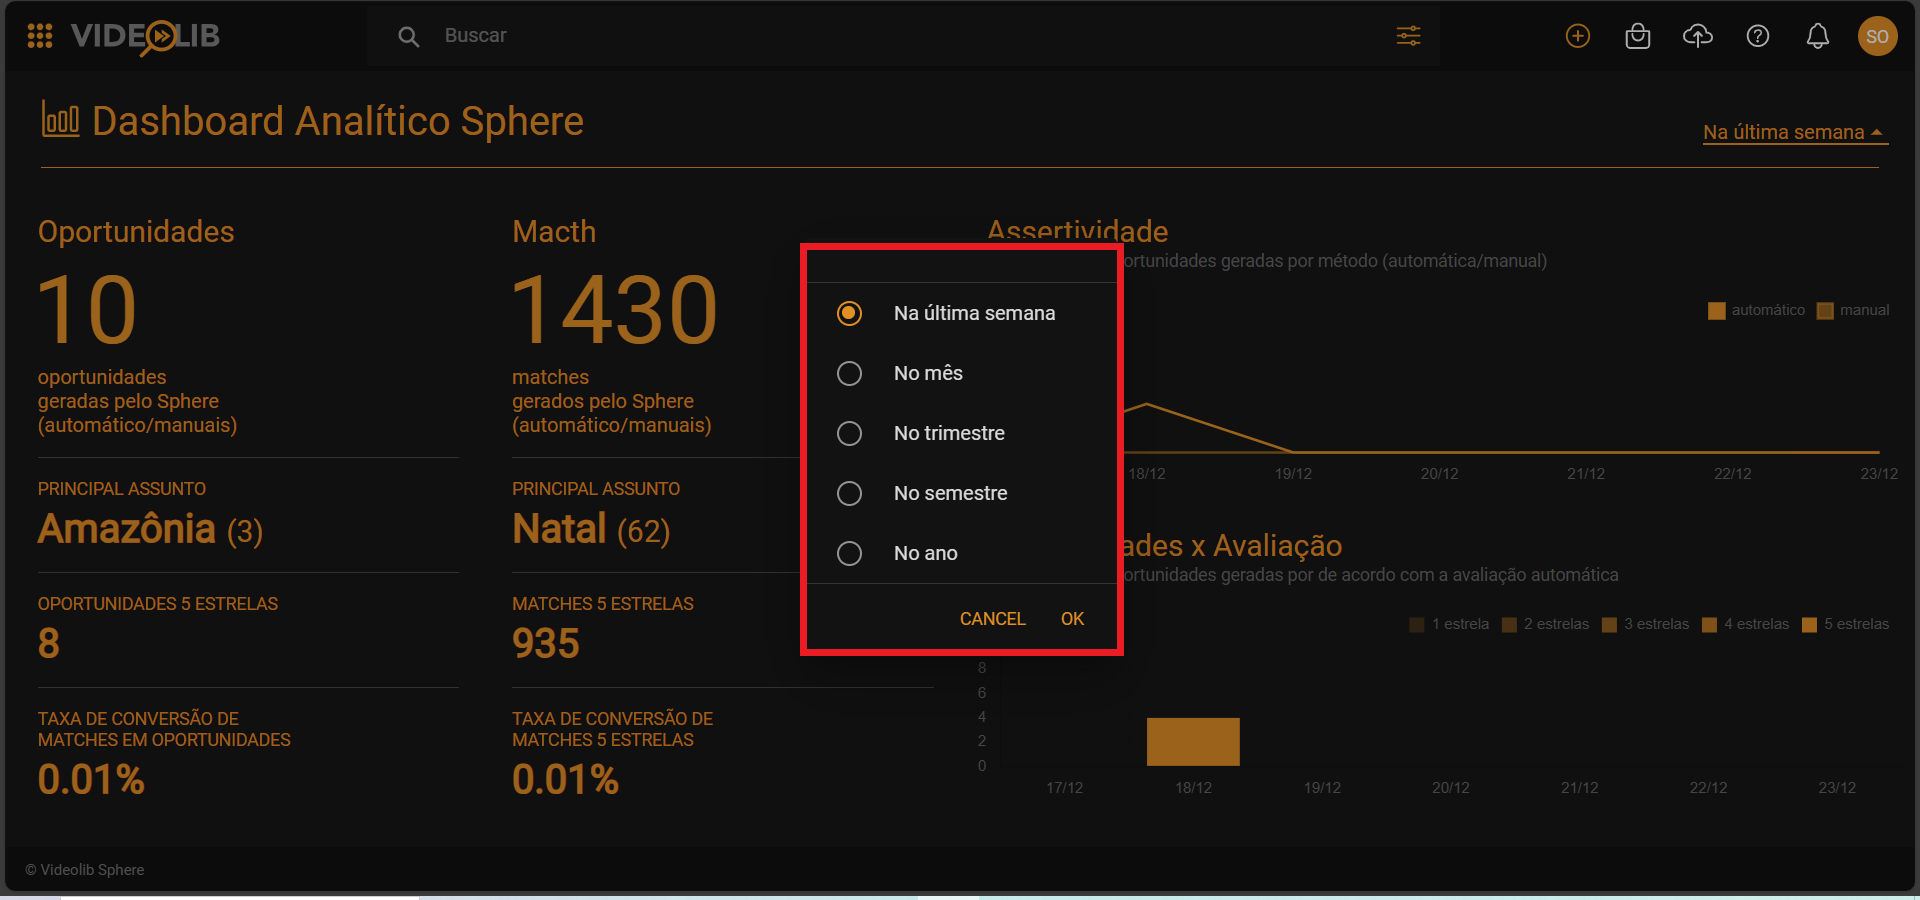
Charts can be filtered by period: last week, month, quarter, half-year, or year.
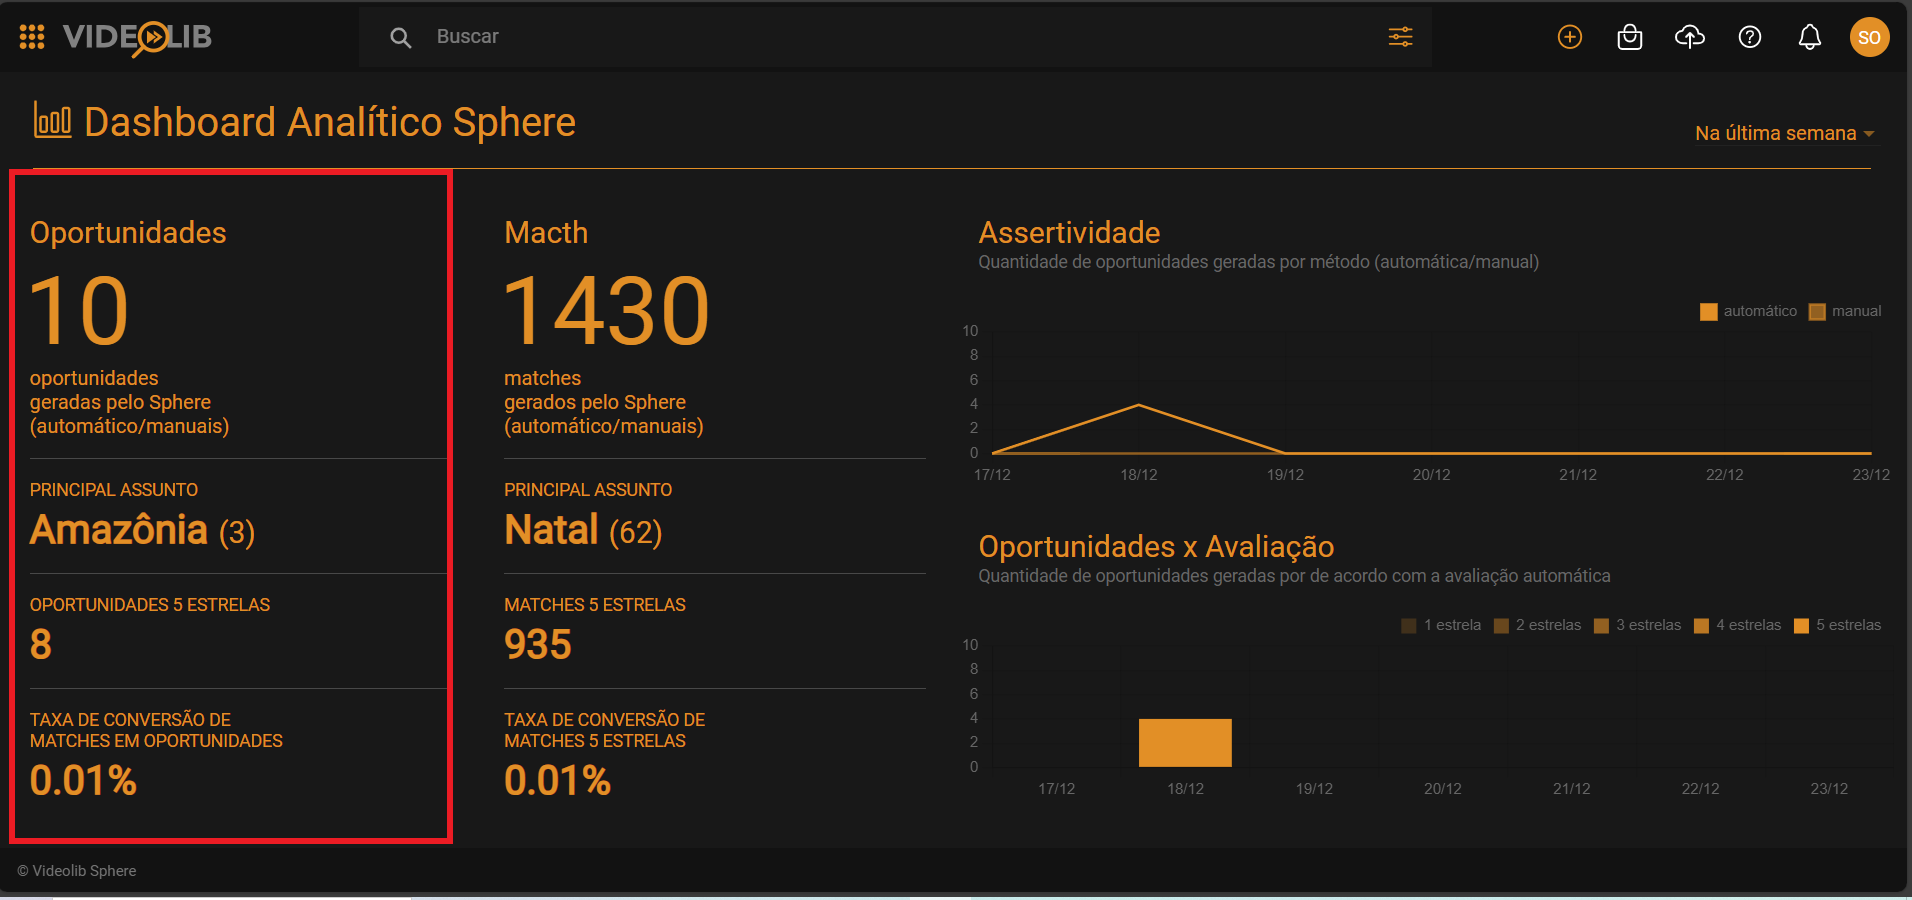
Opportunities
Left panel with number of opportunities, main topic, 5-star opportunities, and conversion rate.
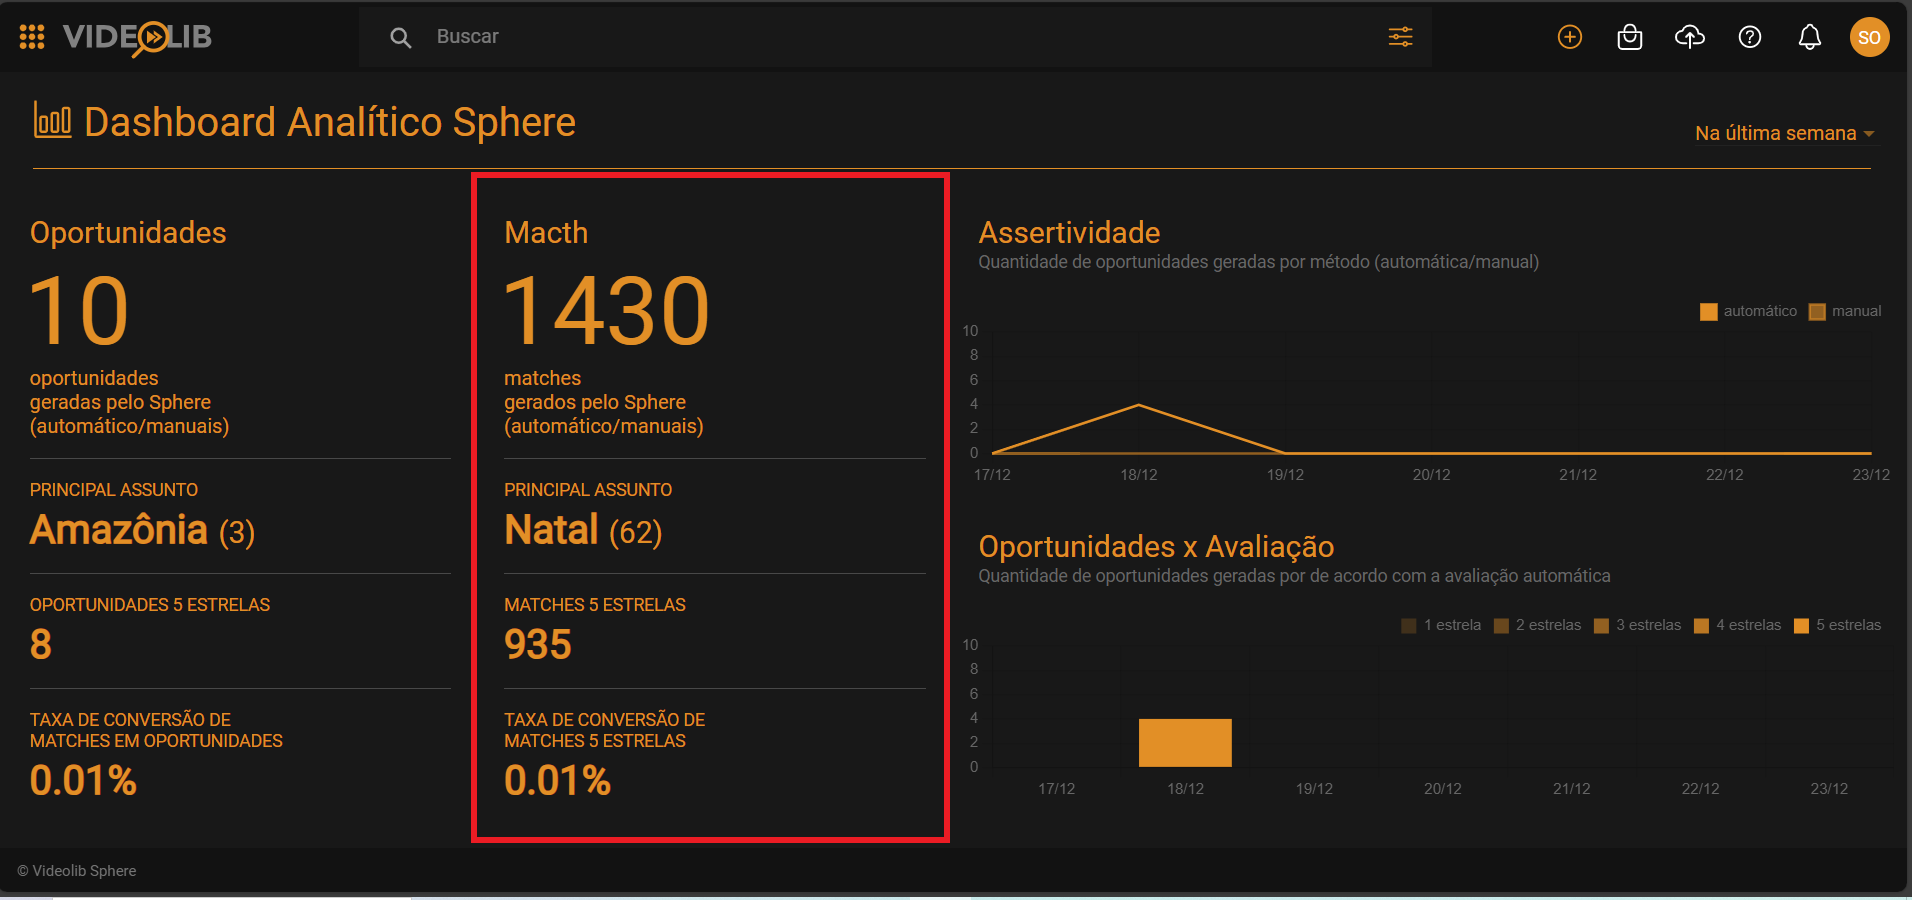
Matches
Middle panel with number of matches, main topic, 5-star matches, and conversion rate.
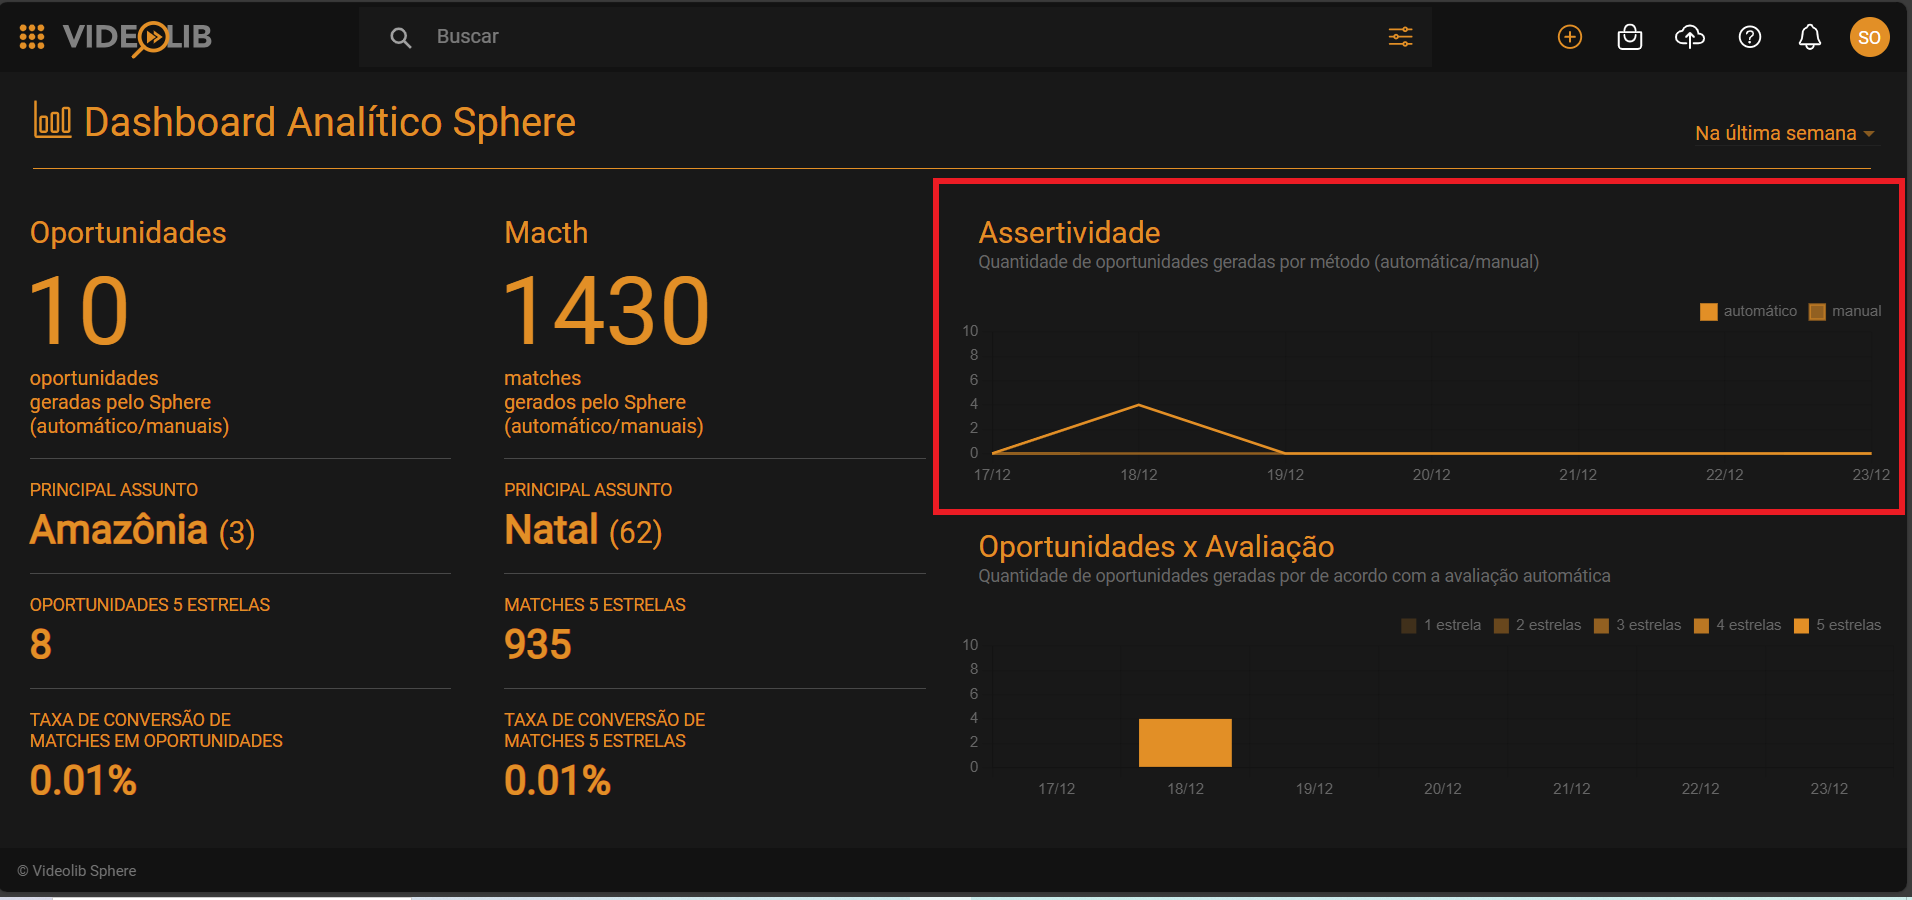
Accuracy
Chart showing opportunities generated by manual vs automatic match.
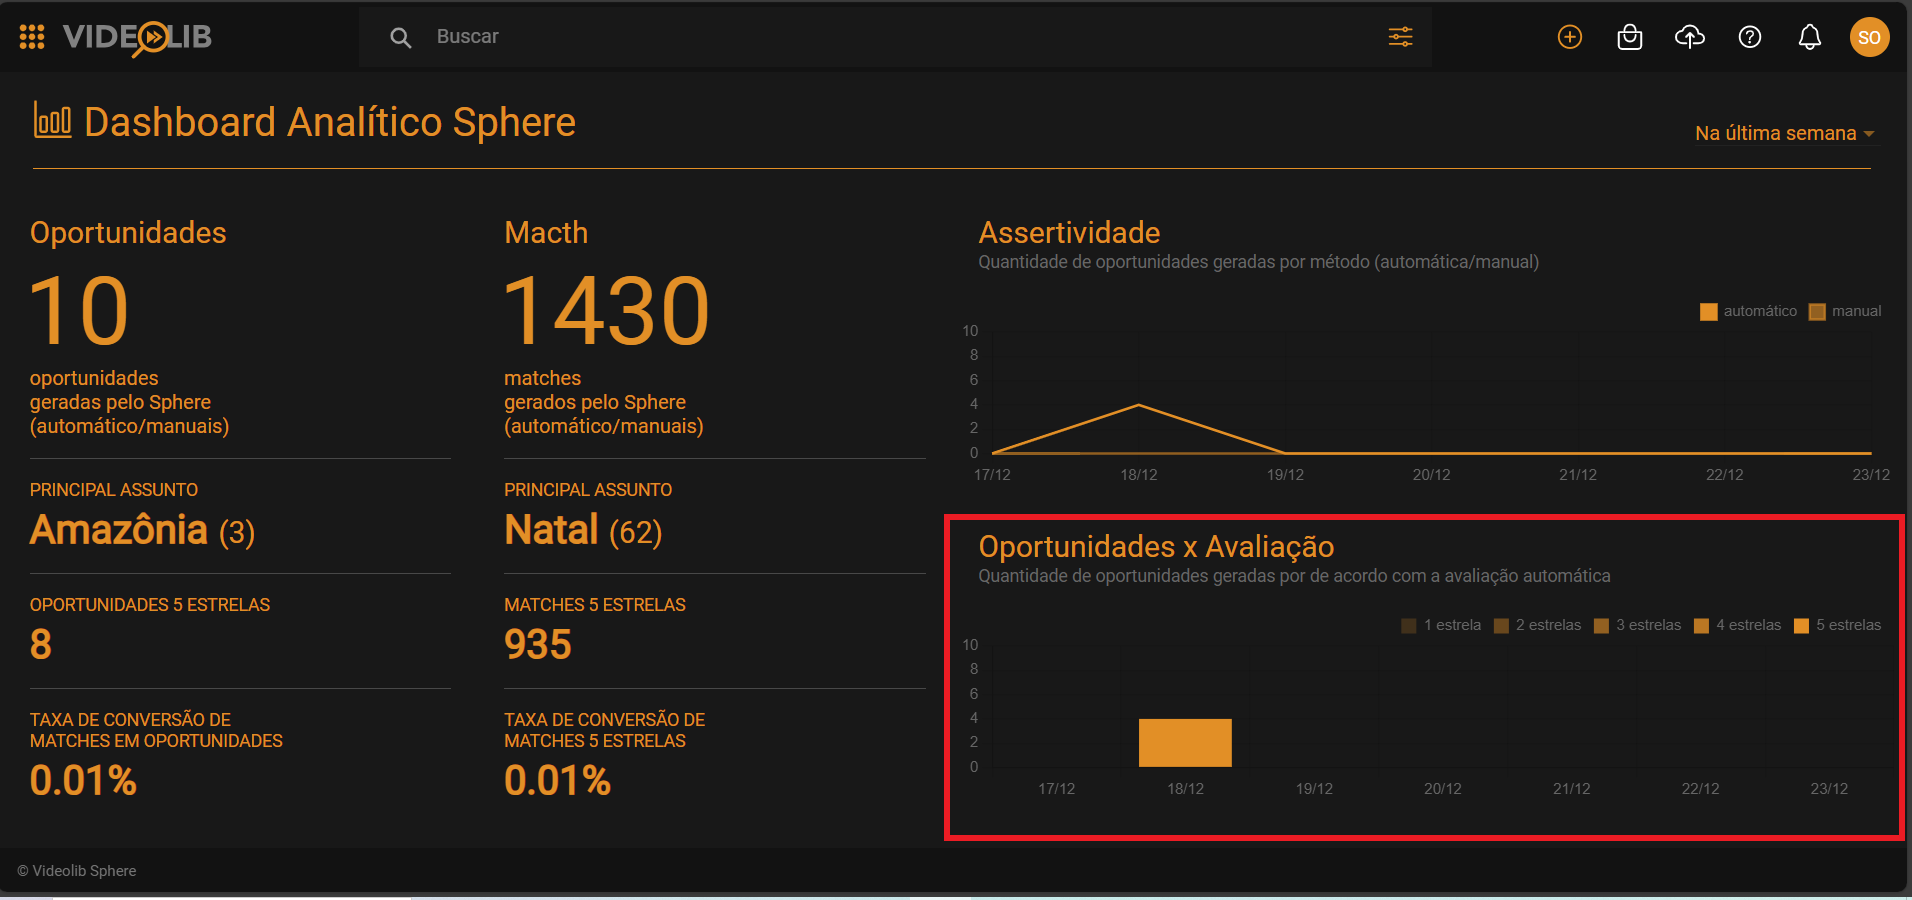
Opportunities vs Rating
Chart showing opportunities generated based on match ratings.